Analytics and Visualization
Compare products side-by-side and find opportunities to optimize your product family using different perspectives. Validate your products or see how they stack up against your competition.
See how your product family cover the needs of the market
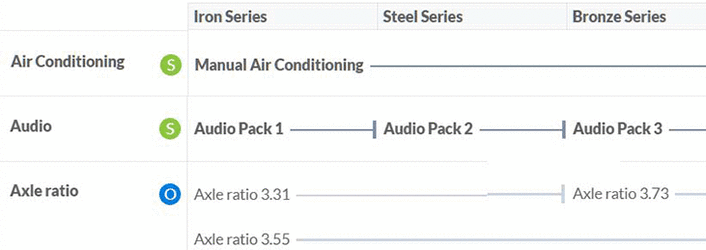
Gocious generates different views into your product line from one set of rules and product definition. The Product Walk shows how features progress from one product to another, while the specification report shows the range of specifications from one product to the other.

Compare products side-by-side
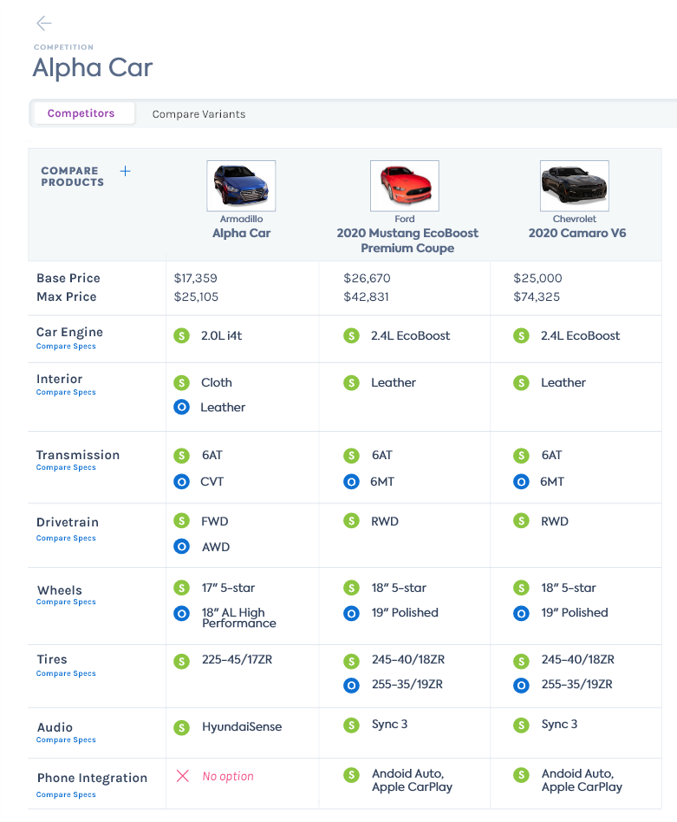
Compare competing or complimentary products using the Comparison report. Change configurations to consider different scenarios and optimize your product line. Use it for competitive analysis or to describe your product family in a way that is easy to understand.

Drive alignment across your organization
The product configuration drives the input to the analytics. Get answers quickly without having to recreate reports just because the product changed. Everyone is working in alignment and to the correct level of product data.

See the whole product picture
We give you reporting and analytics across all your product variants. Why sample a few variants when you can analyze them all? Get the complete picture so you can be aware of everything.


